实用工具

SQL语法

学习资料

其实不麻烦,几个小时看一遍这个就懂了 https://www.runoob.com/sql/sql-tutorial.html

经典解读

以我们最常用的这个模板作为解读

 1select
 2    count(*) as pv,
 3    count(distinct cuid) as uv,
 4    event_type,
 5    break_max,
 6    push_active_level,
 7    (case when sid like '%30864_6%' then '30864_6' when sid like '%30864_7%' then '30864_7' end) as exp
 8from
 9    default.xxxxxx_ads_push_dimension_info
10where
11    event_type in ('ack', 'click')
12    and event_day = '20220522'
13    and source in  ('1', '2')
14    and is_all = '2'
15    and tag_type in ('2', '3', '5')
16    and (sid like '%30864_6%' or sid like '%30864_7%')
17group by
18    event_type,
19    exp,
20    break_max,
21    push_active_level

解读一下。其实就四个部分: select, from, where, group by

首先,拿到一个需求,比如需要统计什么,最重要的是select。因为这会是最后展示结果的结构

from就是从哪个表里找

where就是一些限制条件。注意,这里的条件可以出现或者不出现在select中,比如这个案例里的source和is_all
这里有些in, = , like的判断,看看菜鸟教程就好。sid like ‘%30864_6%’ 就是30864_6前后都可以有其他内容
group by是因为select的时候有count,也就是计数。在select中除了count的行,都要在这里展示。
比如,select中除了count,还有A,B,C。分别有3,4,5种可能。那么交叉一下,返回的结果表里就会有3*4*5种可能。通过count去计数
所以select中出现的除了count的行,一定要在group by中出现,不然这个D不知道该怎么办

再解释一下group by

CUID COIN
cuid1 1
cuid2 2
cuid1 4
cuid3 3

比如这个表。如果select CUID, sum(COIN)的时候,如果不group by cuid。其实算的是所有人的coin的sum。所以有这种加减乘除的,要先group by 再在这些小群体里面执行这种加减乘除的操作

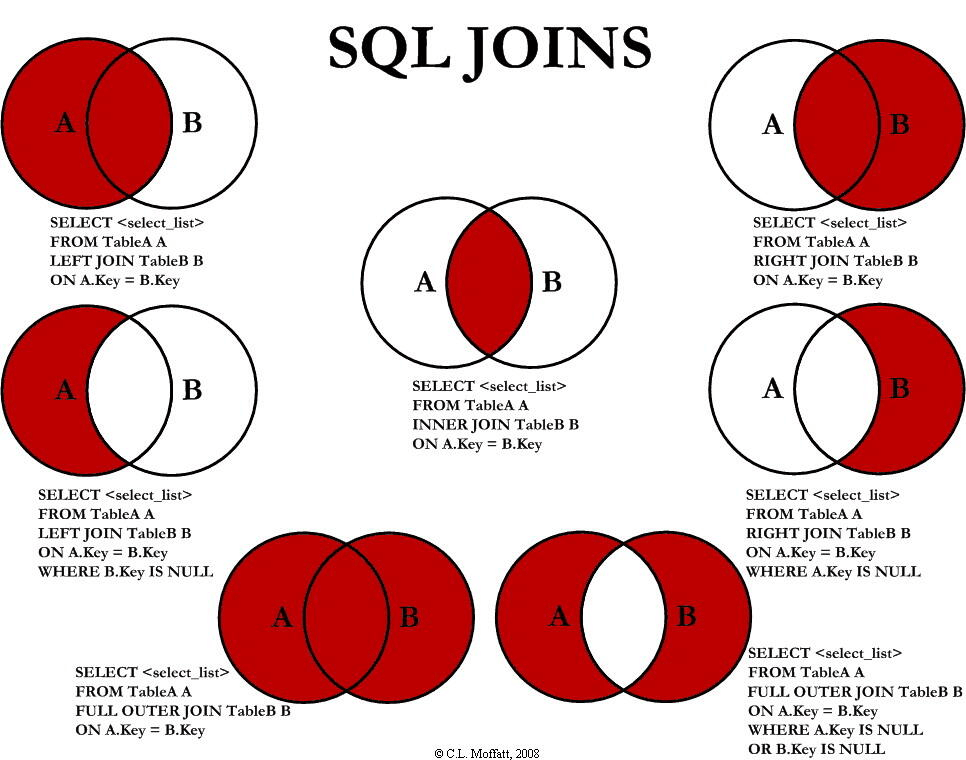
还有一些join(inner join), left join的语法。还有一些as(别名)的语法看看菜鸟教程就好。

../_static/tools/sql-join.png

hadoop常用命令

大部分hadoop命令跟Linux命令相同,只是在使用时需要加上hadoop fs前缀。

各命令请看官方文档: Hadoop Shell命令 http://hadoop.apache.org/docs/r1.0.4/cn/hdfs_shell.html
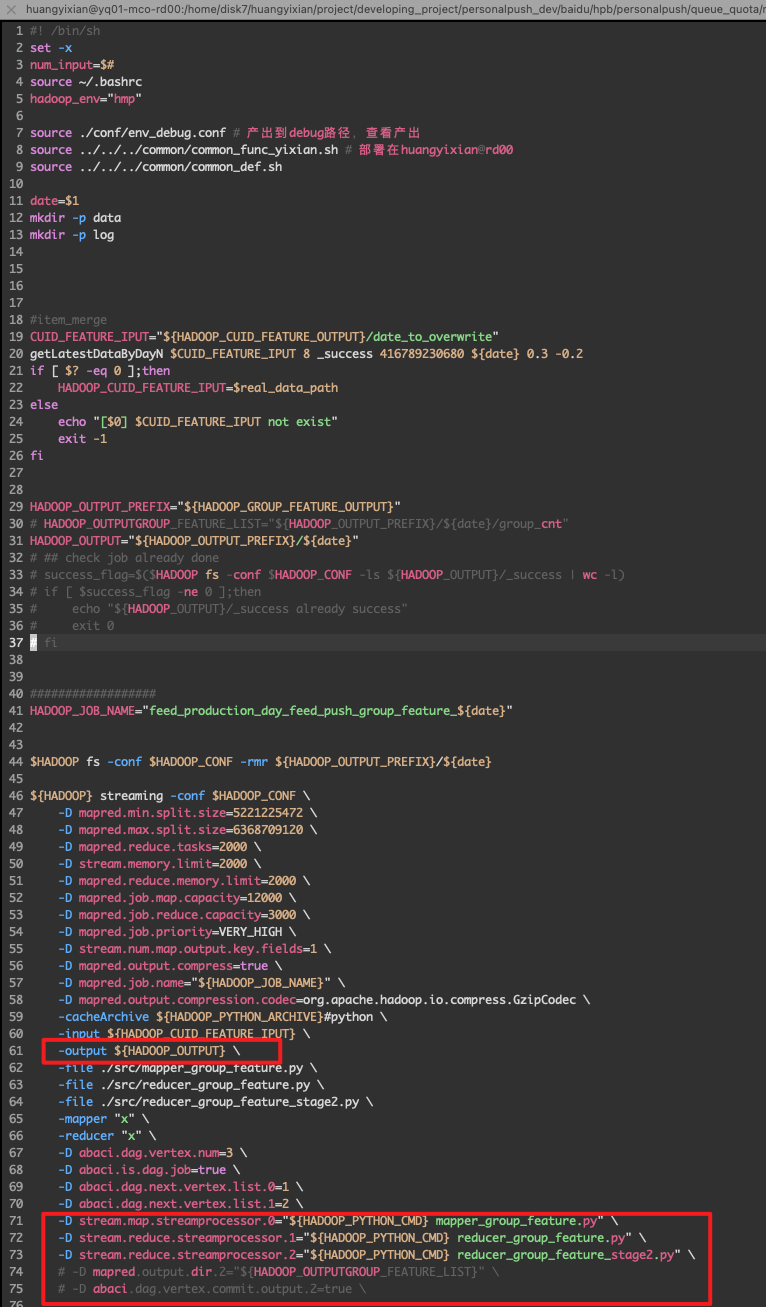
DAG格式

 1$HADOOP_ROOT_HMP/bin/hadoop streaming -conf $HADOOP_CONF \
 2    -D abaci.dag.is.dag.job=true \
 3    -D abaci.split.remote=true \
 4    -D abaci.dag.vertex.num=4  \
 5    -D abaci.dag.next.vertex.list.0=1  \
 6    -D abaci.dag.next.vertex.list.1=2  \
 7    -D abaci.dag.next.vertex.list.3=2  \
 8    -D stream.map.streamprocessor.0="${HADOOP_PYTHON_CMD} feed_nid_cuid_mapper_feed_click.py --exp1_ids=$exp1_ids" \
 9    -D stream.reduce.streamprocessor.1="${HADOOP_PYTHON_CMD} feed_nid_cuid_reducer_join_uid.py" \
10    -D stream.reduce.streamprocessor.2="${HADOOP_PYTHON_CMD} feed_nid_cuid_reducer_print_final.py --tuwen_dict=feed_clk_tuwen_clear --video_dict=feed_clk_video_clear" \
11    -D stream.map.streamprocessor.3="${HADOOP_PYTHON_CMD} feed_nid_cuid_mapper_nid_json.py" \
12    -D mapred.reduce.slowstart.completed.maps=0.9 \
13    -D mapred.reduce.tasks=100 \
14    -D mapred.job.map.capacity=1800 \
15    -D mapred.job.reduce.capacity=100 \
16    -D mapred.map.memory.limit=1500 \
17    -D mapred.reduce.memory.limit=1500 \
18    -D mapred.job.priority=HIGH \
19    -D abaci.job.base.environment=default \
20    -D stream.num.map.output.key.fields=1 \
21    -D mapred.output.compress=true \
22    -D mapred.output.compression.codec=org.apache.hadoop.io.compress.GzipCodec \
23    -D map.output.key.field.separator='#' \
24    -D reduce.output.key.field.separator='#' \
25    -D num.key.fields.for.partition=1 \
26    -D mapred.job.name="${HADOOP_JOB_NAME}" \
27    -partitioner org.apache.hadoop.mapred.lib.KeyFieldBasedPartitioner \
28    -file ../src/feed_nid_cuid_mapper_feed_click.py \
29    -file ../src/feed_nid_cuid_reducer_join_uid.py \
30    -file ../src/feed_nid_cuid_mapper_nid_json.py \
31    -file ../src/feed_nid_cuid_reducer_print_final.py \
32    -file ../src/libMMHash.so \
33    -file ../src/user_hash.py \
34    -file ../dict/experiment_dict \
35    -file ../dict/feed_clk_tuwen_clear \
36    -file ../dict/feed_clk_video_clear \
37    -cacheArchive "${HADOOP_PYTHON_ARCHIVE_WANGHUAN}#python" \
38    -outputformat org.apache.hadoop.mapred.${output_format} \
39    -mapper "cat" \
40    -reducer "cat" \
41    -input ${INPUT_FEED_PATH}/* \
42    -input ${INPUT_NID_JSON_PATH}/part-* \
43    -input ${HADOOP_INPUT_CUID_INDEX}/* \
44    -output $HADOOP_OUTPUT

多输出路径

../_static/tools/dag_multioutput.png

C++ 入门

Model Deployment

Docker

Kubernetes

Model Deployment

describe a project focused on the production phase

like what’s your role in the process? And what tools did you use to production as a model?

from GPT

Project Name: Predictive Maintenance for Manufacturing Equipment

Objective: The goal is to deploy a machine learning model that predicts equipment failures in a manufacturing plant to minimize downtime and maintenance costs.

As a Machine Learning Engineer, my role in the production phase includes the following responsibilities:

Model Deployment: Deploying the trained machine learning model into a production environment.
API Development: Creating APIs to serve the model predictions.
Monitoring & Maintenance: Monitoring the performance of the deployed model and maintaining its accuracy over time.
Security: Ensuring that the deployed model and its endpoints are secure.
Automation: Automating the deployment and monitoring processes to ensure smooth operations.
Tools and Technologies Used
Model Deployment:
TensorFlow Serving: For serving the machine learning model.
Docker: For containerizing the model and its dependencies.
Kubernetes: For orchestrating containerized applications.
API Development:
Flask: For developing RESTful APIs to serve model predictions.
FastAPI: An alternative for high-performance API development.
Monitoring & Maintenance:
Prometheus: For monitoring model and system performance metrics.
Grafana: For visualizing the performance metrics.
Seldon Core: For deploying, scaling, and monitoring machine learning models on Kubernetes.
Security:
JWT (JSON Web Tokens): For securing API endpoints.
SSL/TLS: For securing data in transit.
Automation:
Kubeflow: For end-to-end machine learning workflows, including deployment and monitoring.
Airflow: For orchestrating and scheduling batch predictions or retraining workflows.

Production Phase Workflow

Model Training and Validation:
Train the machine learning model using historical data.
Validate the model to ensure it meets performance requirements (e.g., accuracy, precision, recall).
Containerization:
Create a Docker image containing the trained model and necessary dependencies.
Write a Dockerfile to specify the environment and dependencies.
API Development:
Develop a Flask or FastAPI application to serve model predictions.
Define endpoints for making predictions and for health checks.
Deployment:
Deploy the Docker container to a Kubernetes cluster.
Use TensorFlow Serving or Seldon Core for serving the model in a scalable manner.
Expose the API endpoints using Kubernetes services and ingress controllers.
Monitoring & Logging:
Configure Prometheus to collect metrics related to model performance (e.g., response time, error rates).
Set up Grafana dashboards to visualize these metrics.
Implement logging to track prediction requests and responses.
Security Measures:
Secure API endpoints using JWT for authentication.
Configure SSL/TLS for secure communication.
Automation and Retraining:
Use Kubeflow or Airflow to automate the deployment pipeline and retraining process.
Schedule periodic retraining of the model using new data to maintain accuracy.

Outcome

By following this approach, the machine learning model for predictive maintenance is successfully deployed into production, enabling real-time predictions of equipment failures. The use of containerization and orchestration ensures scalability and reliability. The deployment pipeline is automated to allow for seamless updates and retraining, ensuring the model remains accurate over time. Monitoring tools provide visibility into the model’s performance, enabling proactive issue resolution.

This structured production phase ensures that the predictive maintenance system operates efficiently, reducing equipment downtime and maintenance costs, and ultimately improving operational efficiency in the manufacturing plant.

after the model is in production or went online, how do you monitor the model.

Monitoring a machine learning model in production is crucial to ensure its performance, reliability, and integrity. Here are the key steps and practices to effectively monitor a model once it is deployed:

1. Performance Monitoring
Accuracy Metrics: Continuously track model performance metrics such as accuracy, precision, recall, F1 score, etc. depending on the type of problem (classification, regression, etc.).
A/B Testing: Use A/B testing to compare the performance of different model versions in real-time.
2. Data Drift and Concept Drift Detection
Data Drift: Monitor for changes in the input data distribution. Sudden changes in data distribution might indicate that the model is receiving different types of data than what it was trained on.
Concept Drift: Check if the statistical properties of the target variable change over time, which might necessitate model retraining or adjustments.
3. Operational Metrics
Latency: Measure the time taken for the model to make predictions. Ensure that it meets the required performance criteria.
Throughput: Track the number of predictions made per unit time to ensure the system can handle the load.
Error Rates: Monitor the rate of errors or exceptions encountered during predictions.
4. Logging and Alerts
Logs: Implement comprehensive logging for all aspects of the model, including input data, predictions, errors, and model decisions.
Alerts: Set up alerts for abnormal behavior such as spikes in error rates, significant drops in performance metrics, or deviations in data distributions.
5. User Feedback and Human-in-the-Loop
User Feedback: Collect feedback from end-users about the model’s predictions to identify any issues or areas for improvement.
Human-in-the-Loop: Involve human experts to review model predictions, especially in high-stakes or critical applications, to ensure reliability.
6. Security and Compliance
Security: Monitor for any security vulnerabilities or breaches that could compromise the model or the data it uses.
Compliance: Ensure the model adheres to regulatory and compliance requirements. Regular audits might be necessary depending on the industry.
7. Retraining and Model Updates
Scheduled Retraining: Periodically retrain the model with new data to ensure it remains accurate and relevant.
Model Versioning: Keep track of different versions of the model and their performance. Use canary deployments to gradually roll out new versions.
Tools and Technologies for Model Monitoring:
Monitoring Platforms: Tools like Prometheus, Grafana, or ELK stack (Elasticsearch, Logstash, Kibana) can be used for monitoring and visualization.
Model-Specific Monitoring: Platforms like Evidently AI, WhyLabs, or open-source libraries such as Alibi Detect for drift detection.
Cloud Services: AWS SageMaker, Azure ML, or Google AI Platform provide built-in monitoring and logging features for deployed models.
Implementing these monitoring practices helps ensure that the model remains effective, reliable, and continues to deliver value in a production environment.

将机器学习模型部署到生产环境后,监控其性能、可靠性和完整性至关重要。以下是有效监控模型的关键步骤和实践:

1. 性能监控
准确度指标: 不断跟踪模型的性能指标,如准确度、精确度、召回率、F1分数等,具体取决于问题类型(分类、回归等)。
A/B测试: 使用A/B测试实时比较不同模型版本的性能。
2. 数据漂移和概念漂移检测
数据漂移: 监控输入数据分布的变化。数据分布突然变化可能表明模型接收到与训练数据不同类型的数据。
概念漂移: 检查目标变量的统计属性是否随时间变化,这可能需要重新训练或调整模型。
3. 运行指标
延迟: 测量模型进行预测所需的时间。确保满足所需的性能标准。
吞吐量: 跟踪单位时间内进行的预测数量,以确保系统能够处理负载。
错误率: 监控预测过程中出现的错误率或异常率。
4. 日志记录和警报
日志: 对模型的所有方面(包括输入数据、预测、错误和模型决策)实施全面的日志记录。
警报: 设置警报,以便发现异常行为,如错误率飙升、性能指标显著下降或数据分布偏离。
5. 用户反馈和人工干预
用户反馈: 收集用户关于模型预测的反馈,以发现任何问题或改进的领域。
人工干预: 涉及人类专家审查模型预测,特别是在高风险或关键应用中,以确保可靠性。
6. 安全和合规性
安全: 监控可能危害模型或其使用数据的安全漏洞或违规行为。
合规性: 确保模型符合法规和合规要求。根据行业不同,可能需要定期进行审计。
7. 重新训练和模型更新
定期重新训练: 定期使用新数据重新训练模型,以确保其保持准确和相关。
模型版本管理: 跟踪不同版本的模型及其性能。使用金丝雀部署逐步推出新版本。
型监控的工具和技术:
监控平台: 可以使用诸如Prometheus、Grafana或ELK堆栈(Elasticsearch、Logstash、Kibana)等工具进行监控和可视化。

CI/CD

what is the end to end machine learning life cycle.

1. Problem Definition
Objective: Define the problem and goals.
Activities: Understand business requirements and set success metrics.
2. Data Collection
Objective: Gather relevant data.
Activities: Collect data from various sources.
3. Data Preprocessing
Objective: Clean and prepare data.
Activities: Handle missing values, normalize data, and encode categorical variables.
4. Exploratory Data Analysis (EDA)
Objective: Understand data patterns.
Activities: Use statistics and visualization to explore data.
5. Feature Engineering
Objective: Create and select meaningful features.
Activities: Transform raw data into useful features and reduce dimensionality.
6. Model Selection
Objective: Choose the best model.
Activities: Evaluate different algorithms based on performance.
7. Model Training
Objective: Train the model on data.
Activities: Optimize model parameters using training data.
8. Model Evaluation
Objective: Assess model performance.
Activities: Use test data to evaluate metrics like accuracy and precision.
9. Model Tuning
Objective: Improve model performance.
Activities: Optimize hyperparameters using techniques like grid search.
10. Deployment
Objective: Deploy the model to production.
Activities: Package and deploy the model, set up APIs or batch processing.
11. Monitoring and Maintenance
Objective: Ensure ongoing performance.
Activities: Monitor performance, set up alerts, and retrain with new data.
12. Documentation and Communication
Objective: Document process and communicate results.
Activities: Maintain detailed documentation and prepare reports for stakeholders.
13. Continuous Improvement
Objective: Enhance model over time.
Activities: Iterate based on feedback and new data, explore new features and models.

system Design

https://www.youtube.com/watch?v=KYExYE_9nIY

whimsical

sql vs nosql

先问些问题,比如user Number,text image video? xxx这些功能是否需要

打开 whimsical

做一些文字记录,关键数据

calculation: 然后开始计算内存

都有哪些组成部分 title timestamp comments

each character int 2 bytes

需要一些 mircoservice

web server
app server
ranking service
feed service
user services (has db)
post service (has db) nosql server - horizontal scalability, shard by post id (consistant hash)
object store to store images
Load Balance

sql vs nosql

cache